Audio is often viewed as a confusing, complicated secondary benefit in
the home theater environment when compared to video. One issue that has
contributed to this situation is that the consumer has no objective way
to qualify the components they buy either individually, or as part of
a system. Every product claims to provide a great listening experience,
and the user has little to judge this claim on other than price. This
workgroup set out to propose a consumer-friendly quantifiable metric for
audio systems that can help provide a great listening experience for the
user, as well as generate market growth through increased awareness of
the value of quality components.
With most areas of consumable technology, the marketplace has settled
on simple, top-level metrics that help guide the consumer through levels
of relative performance. This is often a single metric that is typically
inadequate for the educated consumer, and is even arguably a potential
source of misguidance, but its overall value to the uninformed consumer
is undeniable: When shopping for a digital camera, the pixel count becomes
the main guide. For a computer, gigahertz is put up for measure until
recently; now it is the number of cores. The value for the consumer is
achieved whether they understand the metric or not, simply because a common
metric exists that can provide a relative scale between products. A camera
with six mega-pixels is understood to be better than one with three, and
the non-technical consumer can make a reasonably informed choice.
With audio products, no “primary” metric exists. In general,
audio products at any price point claim to provide “excellent”
audio quality, without any clear way for the consumer to quantify what
this means (other than price, and possibly size). Some audio measurement
terms (such as watts) are used to quantify some components, but they are
often misused (no reference to distortion, for example) and fail to provide
any merit in characterizing the entire audio system.
In general, when a consumer is given a choice to purchase a superior
experience, they are likely to choose it (within their price range). If
a single metric existed that enabled consumers to compare the relative
merits of audio gear, then the consumer would likely spend at the higher
range of their price band and would benefit from a superior audio experience.
To do this, the entire signal chain must be taken into account in order
to derive a single composite score that can represent the quality of the
entire audio system for the user. This system would also provide the benefit
of identifying which components are the weakest link within the scoring
system, which would guide the consumer to their next component for improved
audio performance. This workgroup report will attempt to provide an example
of how such a system could be implemented.
The recommendation for the solution is a tool which can present the user
a simple score that represents the lowest value in the signal chain. This
tool can be in the form of a web tool or an application downloaded from
a manufacturer’s website. Manufactures may find this tool useful
for informing customers about potential problems with audio quality on
a system and provide options for upgrading to a better solution.
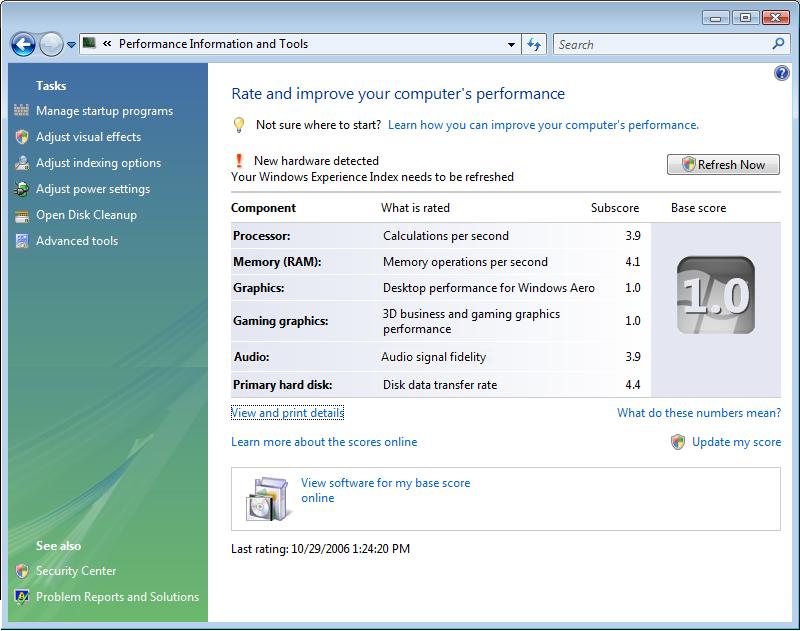
The Windows Vista operating system includes a new control panel called
the “Performance Information and Tools”. This control panel
gives customers a simple score called the Windows Experience Index which
is calibrated from the components included in a computer system. It should
be possible to extend this to provide an end-to-end rating of the entire
audio signal chain.
To determine the score, we identified six categories of audio elements
which can be combined to provide a composite score for the audio system
as a whole. We further dissected each category to determine the critical
factors for that category. A table containing these categories is included
at the end of this report.
Above is an illustration of how an aggregate score for end-to-end audio
performance could be visualized in the performance control panel.
When selecting the “Refresh now” button or
the “Update my score” link, a dialog will
be displayed indicating that the system is being profiled.
It may make sense to involve an independent and recognized testing body.
Adding the logo of the testing body (i.e. THX) to the UI would give credibility
to the results of the test.
One of the hardest parts of profiling a playback system is identifying
the speakers. It is crucial to get this information to have an accurate
analysis of the user’s system. Here are screenshots of how this
may look in Windows.
The file provided by the vendor would be similar information to what
is included in the Live Barcode. This information would probably be encoded
using XML with a well-formed schema for speaker characteristics.
Final page of the speaker identification wizard:
The icons provided would be used in places where speakers are displayed
in the user interface. The metadata about the speakers will be input into
the calibration process performed in the “Performance Information
and Tools” control panel.
Each of the categories has multiple audio parameters which can be evaluated
in some way or another and converted to a 1-to-5 scale of ratings. Some
parameters, such as number of speakers, or even dynamic range, can be
converted easily into a 1-to-5 scale. Other parameters may be more difficult
to convert to a 1-to-5 scale. The table below shows each category of device
in the audio chain, with color coding to indicate the difficulty of acquiring
or assessing each parameter. The more difficult parameters are shown in
red, while parameters shown in green should be much easier.
| Node
Type |
|
How
easy to convert to simple metric? (green is easy, red is most difficult) |
Why |
| Render/Speakers |
|
|
|
| |
Discoverability
and/or Identification |
|
USB
all-in-one speaker systems can be discovered and should receive
a higher mark. Other speakers can be identified from the UPC barcode,
or by having the user key in one or more parameters |
| |
Characterized
in public database? |
|
A
public database would probably be the most useful way to establish
relative speaker ratings. Still a lot of work to do here. |
| |
#
of speakers |
|
More
than two speakers is useful only when the listener has content intended
for multi-speaker playback. If multiple speakers are used, they
should be calibrated or corrected for the listenign environment,
and this taken into account for the ratings. |
| |
Distortion |
|
|
A
simple formula should suffice to convert distortion specs to a simple
relative numeric metric |
| |
Frequency
Response |
|
Might
be possible to roughly approximate using room correction algorithms |
| |
|
size
of speakers |
|
Larger
speakers usually have better low-frequency response. |
| |
SPL/Sensitivity
at specified distance and stimulus |
|
Sensitivity
varies widely depending on the speaker's efficiency. This must be
coupled with amplifier power to derive a useful metric. |
| |
Presence
of subwoofer (and brand/UPC if applicable) |
|
A
subwoofer ensures low frequency response in the presence of small
satellite speakers, and well as assuring that LFE soundtracks play
accurately. Ideally the subwoofer should be designed to complement
the other speakers in the system, or use bass management to control
the response. |
| |
Other
characteristics such as impedance and amp matching(?) |
|
Systems
that combine amplifier and speaker in a well-designed combination
should get a higher rating. It will be difficult to identify a
rating for systems put together on an ad-hoc basis. |
| |
|
|
|
|
| Amp/Receiver |
|
|
|
| |
Discoverability
and/or Identification |
|
USB
all-in-one speaker systems with built-in amplifiers can be discovered
and should receive a higher mark. Other speakers can be identified
from the UPC barcode, or by having the user key in one or more parameters |
| |
Characterized
in public database? |
|
A
public database would probably be the most useful way to establish
relative amplifier ratings. Still a lot of work to do here. |
| |
Watts
RMS @0.1% @ 1 kHz continuous tone |
|
For
each channel, a consistent measurement technique for watts must
be employed to allow useful comparisons. The measurement technique
(peak watts, RMS watts, etc) must be clearly specified, as must
the frequency and timbre of the test tone and the distortion point
used for the measurement. |
| |
Frequency
response |
|
Most
amplifiers and receivers have a reasonable frequency response, so
this is very seldom the limiting factor. |
| |
#
of channels |
|
For
this metric, the number of channels should meet or exceed the number
of speakers. |
| |
Type
of interconnect |
|
Digital
lossless interconnects always get the highest score. For analog
connections, cable and connector integrity also becomes a factor |
| |
Analog
input sensitivity |
|
PC
audio systems typically provide 1VRMS or less, while CE systems
usually expect a full range analog input signal of 2.0 VRMS or higher.
Systems with input sensitivity which correctly matches an analog
source should receive higher ratings. |
| |
Volume
control, and whether it is discoverable and remotely controllable |
|
Cascaded
volume controls are big usability problem in any audio system. Proper
level matching is critical for the best listening experience. Improper
level matching can affect many of the other system metrics, especially
if one cascaded volume control in the chain is turned down low,
and a later cascaded volume control is cranked way up to compensate.
Ideally all volume controls should be integrated and synchronized,
and systems built this way should receive a better score. For example,
USB speaker systems or receivers with a HID-based volume control
should get a high mark for this node. |
| |
Peak
limiter, night-time mode/compressor, ability to defeat or control |
|
This
is important to prevent clipping distortion due to misaligned signal
chains, and will help protect speakers from overloads. |
| |
|
|
|
|
| Render
Output Device / DAC (at the PC's jack, or at the point where it
connects to the next subsystem) |
|
| |
Time
alignment with video |
|
This
is important throughout the signal chain, and has a very real impact
on user experience |
| |
Overall
latency |
|
This
can be a negative for interactive voice communications and for real-time
applications such as video games. |
| |
Transport
type (analog, digital, wireless, systems using lossy compression,
etc) |
|
Digital
lossless interconnects always get the highest score. For analog
connections, cable and connector integrity also becomes a factor |
| |
Analog
characteristics (refer to Vista WLP requirements). These measurements
include Dynamic Range, Total Harmonic Distortion, and Frequency Response |
|
For
Windows-based systems, once Microsoft's fidelity requirements are
completely tested, a simple algorithm can be used to convert these
results to a simple relative numeric metric. |
| |
|
Extra
points for metrics which exceed logo |
|
Systems
which rate higher than Microsoft requirements get extra credit |
| |
Resolution
(bit depth/sample rate/lossy compression/perceptual coding) |
|
This
is relatively straightforward to convert to a user-understandable
metric |
| |
#
of channels |
|
For
this metric, the number of discrete channels should meet or exceed
the number of speakers. |
| |
#
and type of jacks |
|
3.5
mm analog jacks get a lower rating than RCA or 1/4" phone jacks.
Coaxial RCA SPDIF jacks get a lower rating than optical jacks. |
| |
Additional
processing capability |
|
Hard
to assign absolute metrics. |
| |
|
|
|
|
| Capture
Input Device / ADC |
|
|
| |
Time
alignment with video |
|
This
is important throughout the signal chain, and has a very real impact
on user experience |
| |
Overall
latency |
|
This
can be a negative for interactive voice communications and for real-time
applications such as video games. |
| |
Transport
type (analog, digital, wireless, systems using lossy compression,
etc) |
|
Digital
lossless interconnects always get the highest score. For analog
connections, cable and connector integrity also becomes a factor |
| |
Analog
characteristics (refer to Vista WLP requirements). |
|
For
Windows-based systems, once Microsoft's fidelity requirements are
completely tested, a simple algorithm can be used to convert these
results to a simple relative numeric metric. |
| |
|
Extra
points for metrics which exceed logo |
|
Systems
which rate higher than Microsoft requirements get extra credit |
| |
Resolution
(bit depth/sample rate/lossy compression/perceptual coding) |
|
This
is relatively straightforward to convert to a user-understandable
metric |
| |
#
of channels |
|
Most
systems require only 2 channels of analog line input. However, home
theatre systems may require 5.1 or 7.1 inputs, while systems in
a music studio will often use as many inputs as are available. |
| |
#
and type of jacks |
|
3.5
mm analog jacks get a lower rating than RCA or 1/4" phone jacks.
Coaxial RCA SPDIF jacks get a lower rating than optical jacks. |
| |
Additional
processing capability |
|
Hard
to assign absolute metrics. |
| |
Mic
Preamp Gain |
|
This
is dependent on the microphone that is selected. Systems with properly
calibrated microphones which expose no user gain control should
receive the highest marks. |
| |
Line-in
preamp gain |
|
If
additional gain is available on a line input, points are counted
off because this ultimately will cause distortion when the user
cranks this control up. |
| |
|
|
|
|
| Mic
|
/
Capture |
|
|
|
| |
Discoverability
and/or Identification |
|
USB
microphones and headsets can be discovered and should receive a
higher mark. Microphone inputs intended to work with unidentified
microphones should receive lower ratings due to the fact that the
end user is in most cases incapable of setting the microphone levels
properly. |
| |
Characterized
in public database? |
|
A
public database would probably be the most useful way to establish
relative microphone ratings. Still a lot of work to do here. |
| |
In-air
measurements |
|
A
standardized methodology does not currently exist, but is a critical
need for unified real-time communications applications. Ideally
in-air microphone testing would manifest as extensions to the audio
fidelity logo tests for Windows systems. |
| |
#
of mics |
|
|
Beamforming
microphone arrays and conference phones perform better with multiple
microphones. |
| |
Frequency
Response |
|
This
could be determined by in-air testing. The frequency of embedded
microphones is almost always affected by the mounting techniques
and location. |
| |
Distortion |
|
|
Microphones
should be free of distortion. In-air testing should be capable of
measuring this parameter |
| |
Sensitivity
and impedance |
|
This
is an issue with unidentified microphones, and can cause considerable
variation in resultant gain settings. |
| |
Microphone
bias power |
|
A
noisy microphone bias supply can significantly degrade the microphone
output quality. However, this is often difficult to measure. |
| |
Pattern |
|
|
Omnidirectional
and cardioid are the most typical mic patterns. The choice of pattern
is often dependent on how the microphone is used. It is also possible
to impact the microphone pattern by mounting a microphone improperly
or with insufficient acoustical porting. |
| |
Integrated
or external |
|
Well-implemented
integrated microphones should receive the highest marks, because
they can be setup and used reliably. External USB or 1394 microphones
can also receive high marks if well-implemented |
| |
Close
Talking |
|
A
close-talking microphone on a headset will almost always provide
a clearer speech signal than a microphone at a distance, and therefore
should have more points awarded. |
| |
|
|
|
|
| System
|
|
|
|
| |
Low
Acoustic Emissions |
|
PCs
with excessive acoustic emissions can drown out audio signals coming
from the speakers or captured by the microphones. Systems with lower
acoustic emissions should get a higher rating. These emissions can
be measured with a simple sound pressure level meter, though no
formal industry spec is available for the PC industry. |
| |
Sufficient
CPU power for native processing |
|
This
is necessary to avoid glitches and dropouts when host-based digital
signal processing is in use. |
 previous